
In the SaaS business, it's easy to deceive yourself. Subscriptions seem to be growing, bills are being paid, but where is the real stable money? To understand how the product is actually developing, you need to look not at "how much money came in for the month," but at recurring revenue - MRR, ARR, LTV, and churn. These four metrics allow you to see the real dynamics, predict growth, and respond to churn in time.
MRR - how much you earn every month
MRR (Monthly Recurring Revenue) is the monthly recurring revenue from active subscriptions. Simply put: MRR shows how much money the company receives consistently, without one-time sales and random payments.
For example, if 100 clients pay $100 per month, and another 50 pay $600 per year, MRR is calculated as follows:
MRR = 100×100 + 50×(600/12) = $12,500
All payments are converted to a monthly equivalent so that different rates are compared fairly. Within billing (such as Stripe or Paddle), this can be calculated with an SQL query that sums all paid subscriptions for the current month.
This approach is important because MRR reflects the health of the business: revenue stability and growth potential.
ARR - a look a year ahead
ARR (Annual Recurring Revenue) is the annual recurring revenue. It's simply MRR multiplied by 12, but it provides strategic understanding: if nothing changes, how much the company will earn in a year from existing clients.
ARR = MRR × 12
Investors love ARR because it shows the scale of the business without seasonal fluctuations and one-time sales spikes.
Churn - the attrition that destroys growth
Even if MRR is growing, you need to look at what percentage of clients are leaving. This is churn - the attrition rate. There are two types:
- Customer churn - the share of clients who canceled their subscription.
- Revenue churn - the share of lost revenue (MRR) due to cancellations.
For example:
if there were 900 clients at the beginning of the month and 30 left, then churn = 30 / 900 = 3.33%.
And if subscription revenue dropped from $1000 to $800, then revenue churn = 200 / 1000 = 20%. The difference is crucial: you can lose 20 cheap clients without noticing it financially, or vice versa - one large client, which will hit MRR harder.
An SQL query for calculating churn usually looks simple - the share of records with canceled_at in the current month from the number active at its start. But this metric allows you to understand how "leaky" your product is.
LTV - how much a client brings over time
LTV (Lifetime Value) is the total value of a client. Simply put, how much money you earn from one user over their lifetime in the service.
The classic formula:
LTV = ARPU / churn_rate
where ARPU is the average revenue per user, and churn_rate is the monthly attrition rate.
If ARPU = $25, and churn = 5% (0.05), then LTV = $25 / 0.05 = $500. This metric helps assess how much can be spent on customer acquisition (CAC) to keep the model profitable. If CAC exceeds LTV - the business is unprofitable, even with revenue growth.

Integrations: where to get data for calculations
The main data is taken from payment systems - Stripe, Paddle, Lemonsqueezy, where information about subscriptions, invoices, and payments is stored. These services allow you to normalize revenue to a monthly equivalent so that MRR and ARR are calculated correctly.
For example, Paddle advises:
- convert daily plans to a month by multiplying by 30 / plan length,
- weekly — by 4.33,
- annual — by dividing by 12.
Analytical platforms like Stripe Sigma or Sequin.io allow you to export this data to SQL and calculate MRR, churn, and LTV directly from the live database.
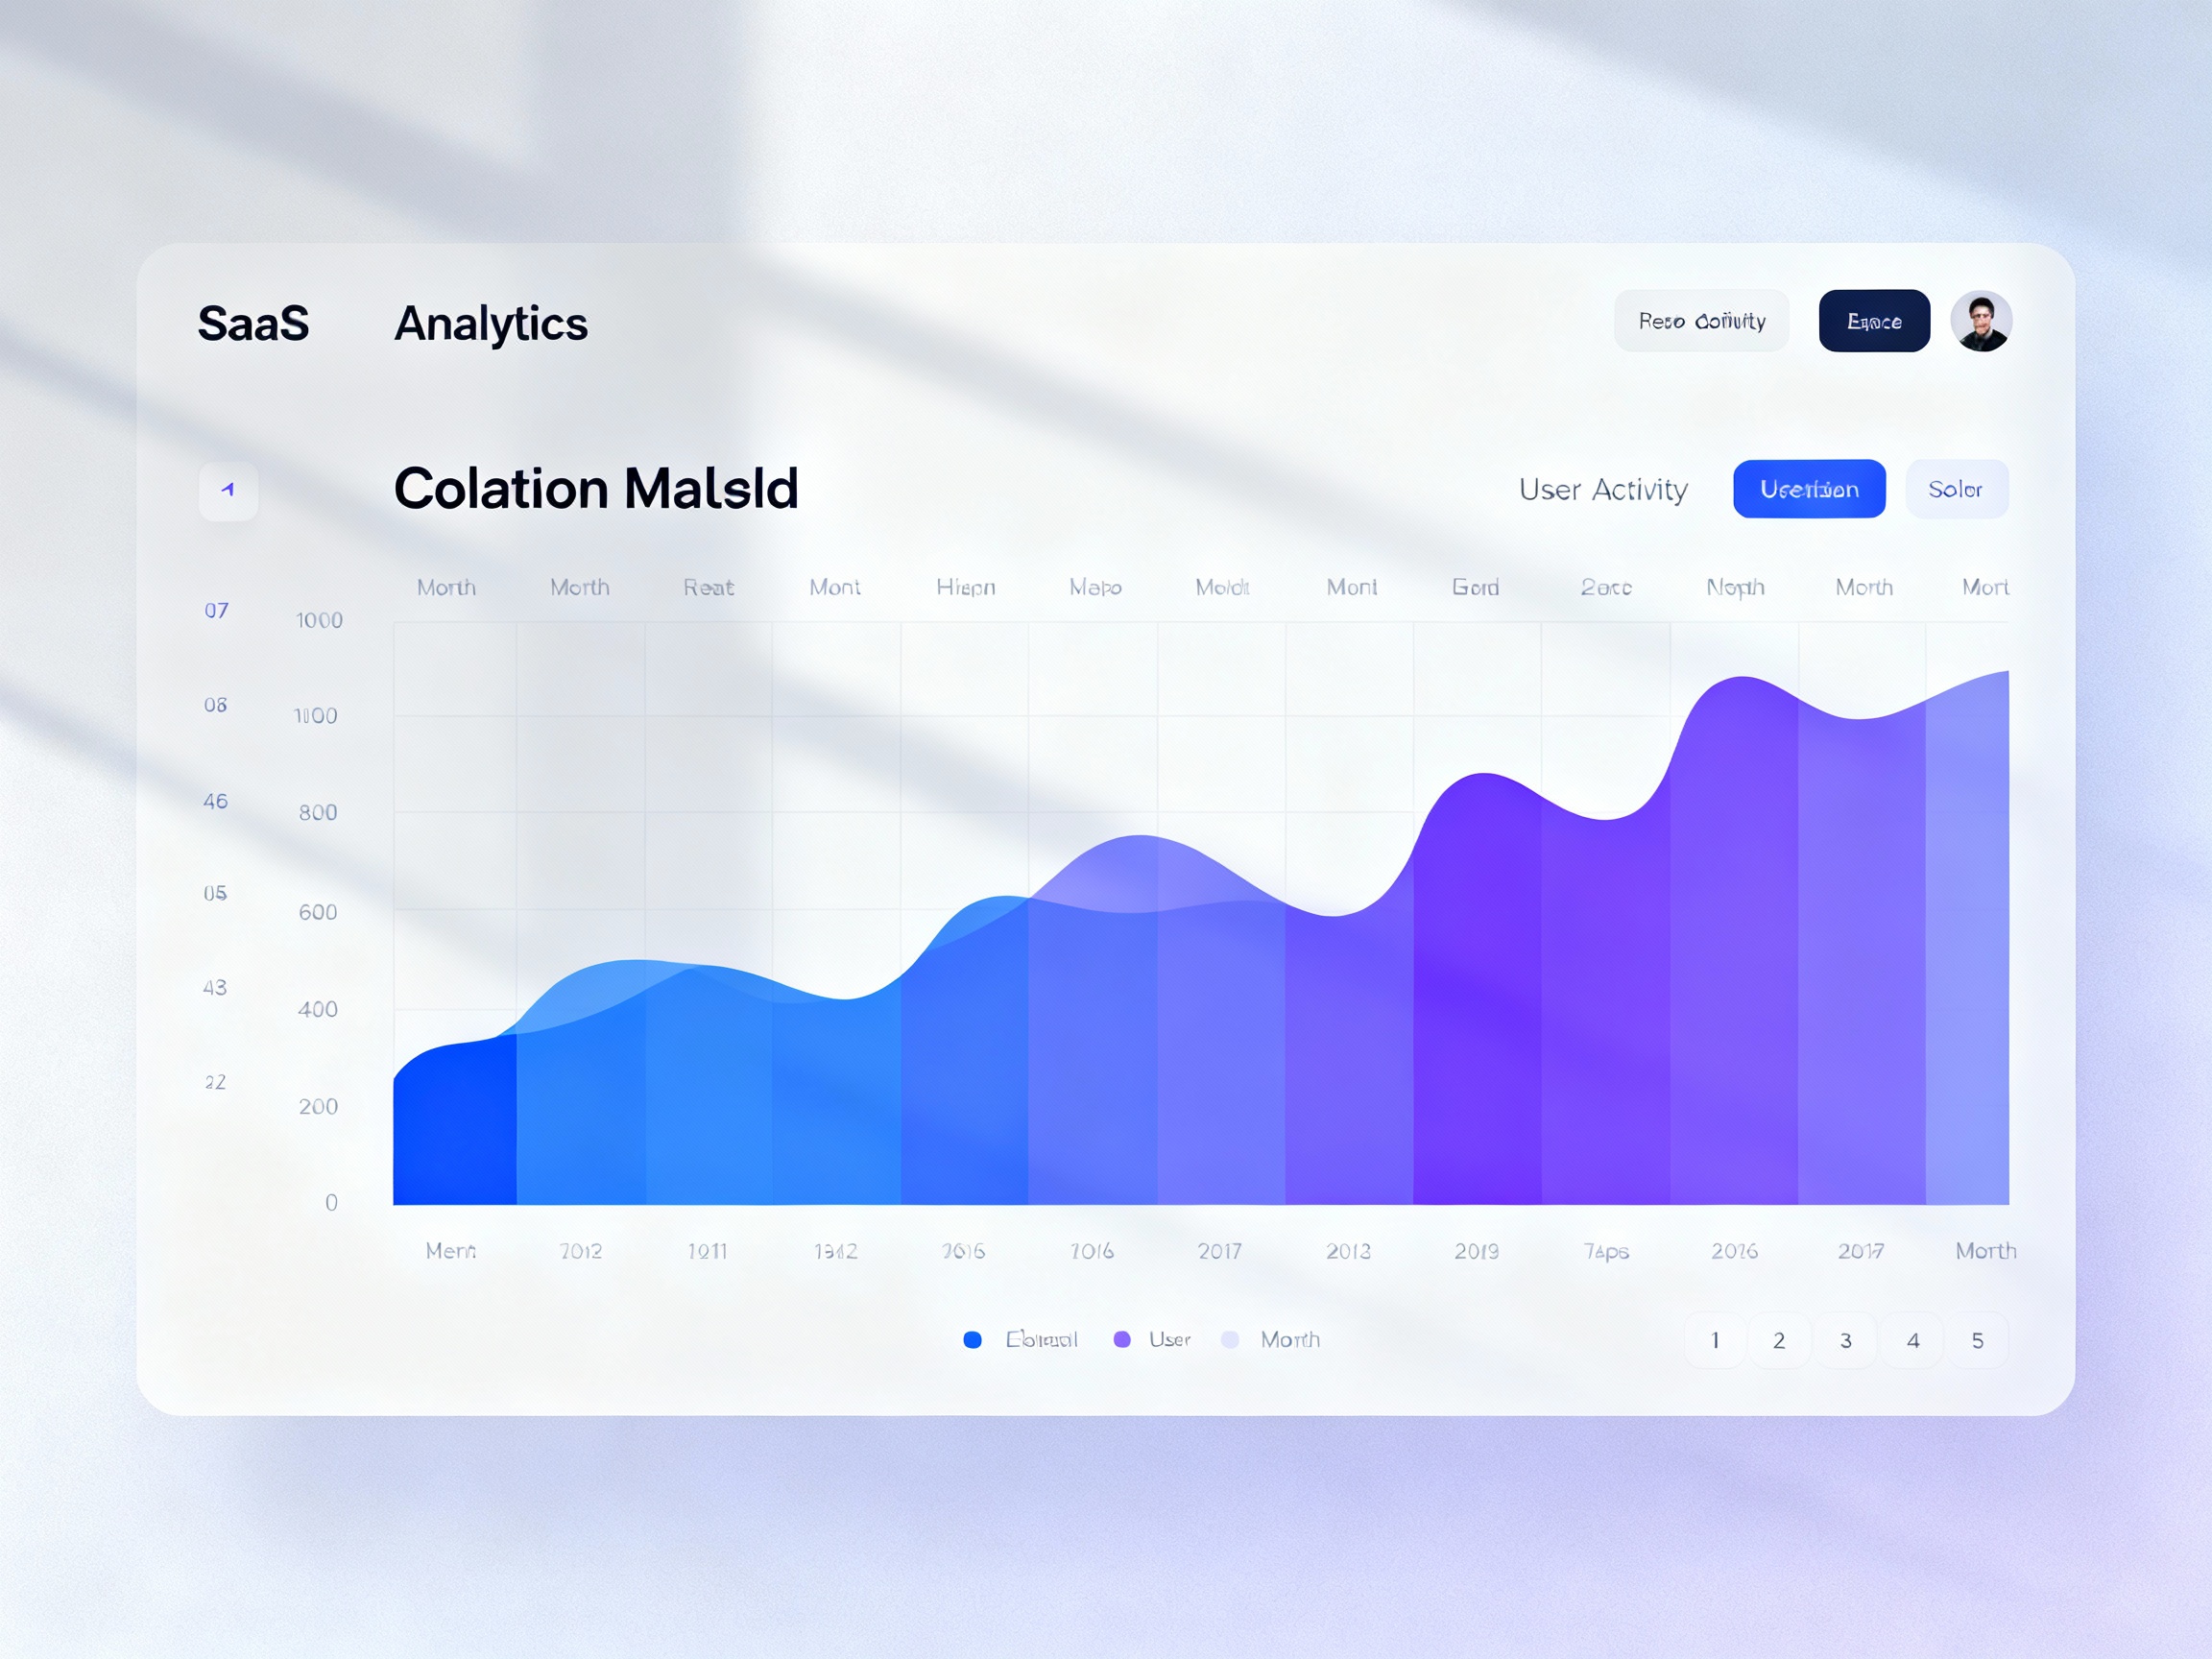
How to visualize and interpret SaaS metrics
Numbers alone say little. Only on charts and dashboards does it become visible where the business is heading: is recurring revenue growing, is growth slowing, is churn increasing. Therefore, MRR, ARR, LTV, and churn always need to be visualized.
Dashboards and tools
For visualization, the following are most commonly used:
- Metabase, Grafana, Supabase Charts - open-source solutions that are easily connected to PostgreSQL.
- Stripe Analytics Dashboard - ready-made charts for MRR, churn, LTV, ARR for projects using Stripe Billing.
- Google Data Studio or Power BI — if a custom report for investors is needed.
Main charts:
- MRR Growth - the curve of monthly revenue growth. Ideally, it grows smoothly, without sharp jumps (this means annual payments are amortized).
- Net New MRR - net MRR growth: new subscriptions minus churn and downgrades. This chart shows in which month you really grew, and where you just compensated for losses.
- Churn Rate - churn trend. With a healthy product, it stabilizes or decreases as MRR grows.
- LTV by cohorts - how much each month a cohort of clients, registered in one period, earns.
Cohort tables are especially useful: they show what percentage of users remain after each month. If less than 60% remain after three months, it's a warning signal.
Key relationships
Metrics do not exist separately - they are interconnected:
- MRR and churn always move in opposite directions. The lower the churn, the more stable the MRR growth.
- LTV and churn are inversely proportional: as churn decreases, the client's lifetime increases.
- ARR grows only when you retain existing clients and add new ones — simply multiplying MRR by 12 means nothing without context.
Essentially, the formula for sustainable SaaS growth looks like this:
Net MRR Growth = New MRR + Expansion MRR − Churned MRR
Where Expansion - upgrades and upsells. If Net MRR Growth is consistently positive - the business is alive and growing. If close to zero - you're treading water.

Common mistakes that distort metrics
Even experienced SaaS project founders often make mistakes that cause reports to "lie." Here are the most common traps:
Accounting annual payments as monthly
If a client paid $1200 for the year, and you added this to MRR in full - the metric will skyrocket and then crash the next month. Such payments need to be amortized: divided over 12 months. Then the chart will be smooth and reflect reality.
Mixing one-time and subscription revenues
MRR is only recurring payments. If you add one-time sales, consultations, or surcharges - you distort the picture. For such cases, it's worth maintaining a separate metric One-Time Revenue.
Including trial users
Trial clients do not yet bring revenue. They should appear in MRR only after the actual first payment. If you count them in advance - metrics will seem better than they are.
Ignoring discounts and refunds
If a client pays $250 with a coupon instead of $350 - MRR should account for $250. Discounts and partial refunds should always reduce the client's contribution to the metric. The same applies to prorated payments during upgrades/downgrades.
Mixing MRR and Bookings
Bookings are just recorded orders, not received revenue. MRR reflects actually active and paid subscriptions, not promises. If these concepts are not separated, the growth chart will "jump" with each large payment.
Lack of segmentation
MRR for all users is an averaged and useless figure. Segment by rates, geography, or client type. Sometimes churn in cheap rates masks stability in the corporate segment - and vice versa.
How to build a metric system in a real SaaS
To calculate everything correctly:
- Collect data - through Stripe/Paddle integrations or SQL replication (Sequin.io, Postgres).
- Normalize revenue - amortize annual plans, exclude one-time payments and trials.
- Automate calculations - a cron or queue that recalculates MRR, churn, LTV daily.
- Visualize - connect Grafana or Metabase, display key charts on a dashboard.
- Analyze trends, not just absolute numbers. Growth without improving churn is an illusion.
Conclusion
MRR and ARR show how much you earn. Churn and LTV - how well you retain clients.
And only together do they form the true picture of the financial health of SaaS.
If you systematically calculate these metrics - you have not just a business, but a managed growth model.
If not - you're flying blind.
Leave a comment
Comment